In Vesta you can easily see the server stats like load, ram usage etc, but you can also check the bandwidth, disk space usage etc for your clients. We will address both things in this article.
To see the account(s) summary:
1. Log into Vesta
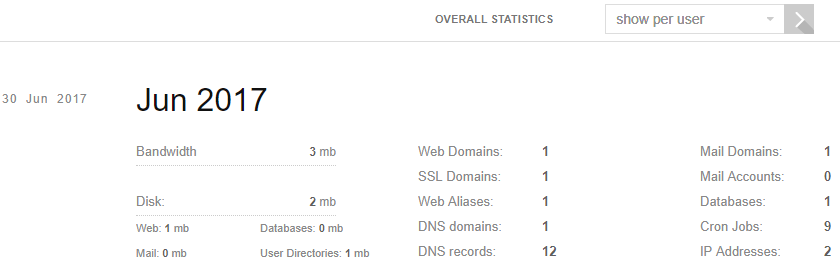
2. Go to Statistics from the top menu
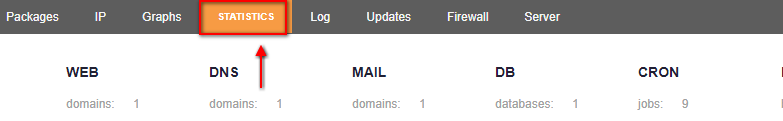
3. You will see stats for your account. If you have multiple domains in your account, select the domain the show per user drop-down list.
To see the server stats (load, memory etc.):
1. Log into Vesta CP
2. Go to Graphs from the top menu
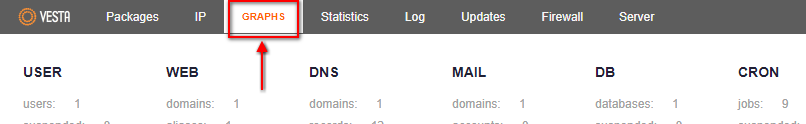
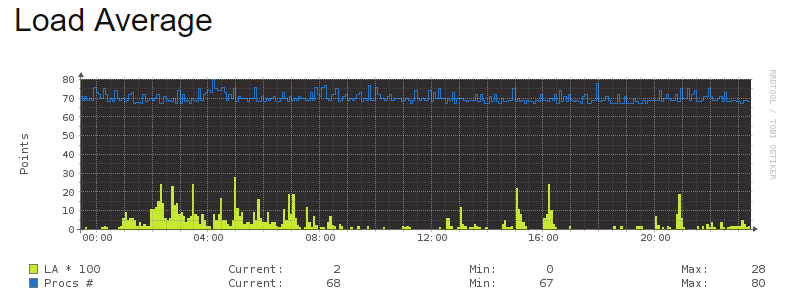
3. You will see graphs for Load Average, Memory Usage, Bandwidth Usage, HTTPD Usage, NGINX Usage, Exim Usage, MySQL Usage, FTP Usage, SSH Usage. Notice that you can choose the time interval you want to check – Daily, Weekly, Monthly and Yearly.
In the image below you can see for example the server Load Average values for the current day.
The movie tutorial for this post: