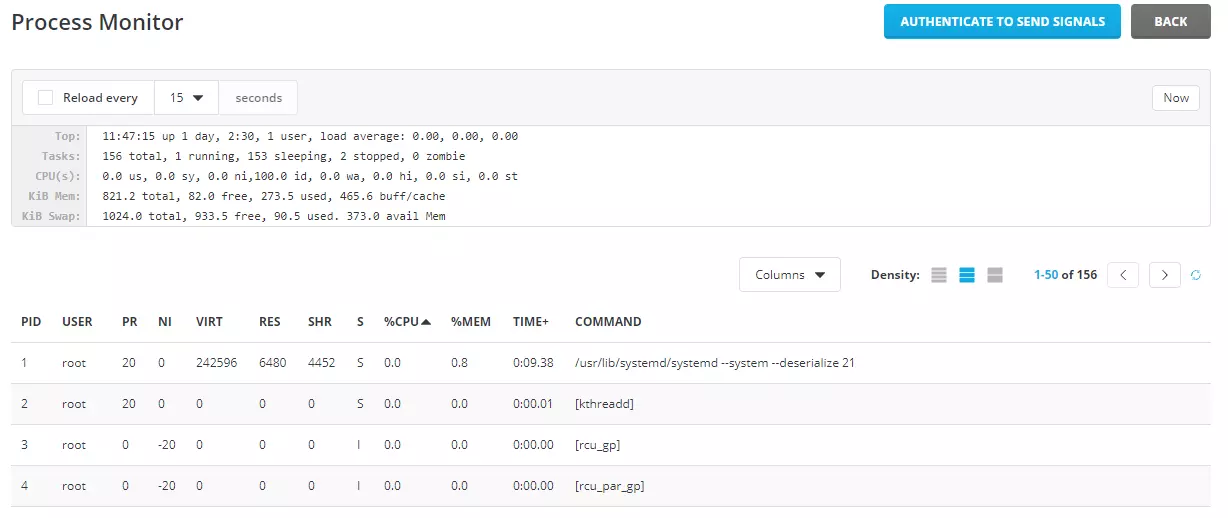
The DirectAdmin Process Monitor tool permits you to see the running server’s processes. It displays mainly the output of the top command.
This KB article is intended for DirectAdmin admin users.
How to access the Process Monitor interface:
1. Enter your DirectAdmin area
2. Navigate to Admin Tools >> Process Monitor
3. Here, you will see the running processes on the server. You can set a reload interval for the list, you can send signals to processes, search, sort them etc.
You can run yourself the top command. You just need to connect first to the server via SSH.
# top[root@web ~]# top
top - 15:22:02 up 7:10, 1 user, load average: 0.00, 0.01, 0.00
Tasks: 93 total, 1 running, 92 sleeping, 0 stopped, 0 zombie
%Cpu(s): 0.1 us, 0.1 sy, 0.0 ni, 99.8 id, 0.0 wa, 0.0 hi, 0.0 si, 0.0 st
KiB Mem : 1310720 total, 793664 free, 293812 used, 223244 buff/cache
KiB Swap: 0 total, 0 free, 0 used. 894420 avail Mem
PID USER PR NI VIRT RES SHR S %CPU %MEM TIME+ COMMAND
868 named 20 0 1333040 47836 3404 S 2.0 3.6 1:34.59 named
83 root 20 0 37896 6828 6516 S 0.3 0.5 0:21.53 systemd-journal
117 root 20 0 26352 1704 1412 S 0.3 0.1 0:01.46 systemd-logind
134 dbus 20 0 26524 1692 1348 S 0.3 0.1 0:02.71 dbus-daemon
407 root 20 0 179976 2020 1424 S 0.3 0.2 0:08.53 rsyslogd
815 apache 20 0 203572 9096 3136 S 0.3 0.7 0:04.11 httpd
1 root 20 0 192680 3640 2296 S 0.0 0.3 0:04.25 systemd
2 root 20 0 0 0 0 S 0.0 0.0 0:00.00 kthreadd/23044
3 root 20 0 0 0 0 S 0.0 0.0 0:00.08 khelper/23044
80 root 20 0 41464 1692 1252 S 0.0 0.1 0:00.01 systemd-udevd
408 root 20 0 6408 804 684 S 0.0 0.1 0:00.00 agetty
411 root 20 0 22752 1524 908 S 0.0 0.1 0:00.16 crond
412 root 20 0 6408 804 684 S 0.0 0.1 0:00.00 agetty
413 mail 20 0 62516 3180 2416 S 0.0 0.2 0:00.03 exim
423 root 20 0 18940 1656 1320 S 0.0 0.1 0:00.02 dovecot
425 mysql 20 0 9476 1496 1208 S 0.0 0.1 0:00.00 mysqld_safe
475 root 20 0 19316 556 352 S 0.0 0.0 0:00.25 da-popb4smtp
..........
You can read more about Linux signals at https://en.wikipedia.org/wiki/Unix_signal
The YouTube tutorial for this KB post: